
Weekly Austin Real Estate Market Update
Austin Real Estate Weekly Market Update - February 13, 2025
by: Team Price Real Estate, Austin's leading data analysis brokerage, where data drives exceptional service
Published on: Thursday, February 13, 2025 at 12:37 pm
Your Guide to the Austin Real Estate Market: Stay ahead in Austin’s dynamic real estate market with Team Price Real Estate. We deliver the latest market insights with daily data updates and in-depth weekly reports, giving you real-time intelligence to make informed decisions. Whether you're buying, selling, or investing, our commitment to accurate, up-to-the-minute analysis ensures you have the tools to navigate the Austin market with confidence.
Updated Market Overview
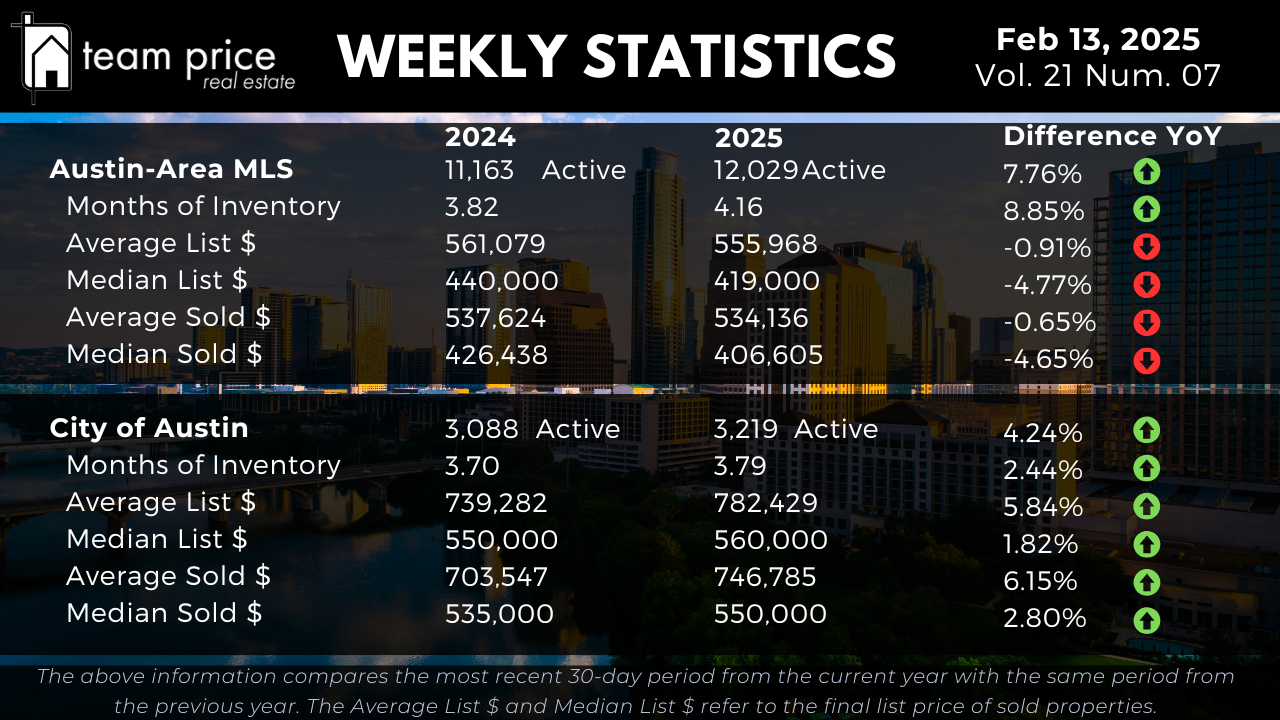
The Austin-area MLS currently has 12,029 active properties on the market, marking a 7.76% increase from last year’s 11,163. The inventory has risen to 4.16 months, up by 8.85% from 3.82 months in 2024. In the City of Austin, inventory has also grown by 4.24% to 3,219 listings, while the Months of Inventory have edged up by 2.44% to 3.79 months.
Pricing Dynamics in Austin Real Estate
The average list price for homes in the Austin-area MLS has dipped by 0.91% to $555,968, while the median active listing price has declined 4.77% to $419,000. On the sales side, the average sold price saw a slight decrease of 0.65% to $534,136, and the median sold price has dropped by 4.65% to $406,605. However, in the City of Austin, the average active listing price has increased by 5.84% to $782,429, with the median active price also rising by 1.82% to $560,000. The average sold price in the city has climbed by 6.15% to $746,785, with the median sold price up by 2.80% to $550,000.
City and Regional Dynamics
Among the 30 tracked cities, 14 have seen a month-over-month price increase, representing 47%, while an equal number of 14 cities (47%) have experienced a decrease. Over the year, only 9 cities, or 30%, have seen price gains, whereas 21 cities, or 70%, have faced declines. Over the past 12 months, no cities have reached new price peaks, with all 30 declining from their highs.
Analyzing the 75 zip codes, 40% have seen price increases month-over-month, while 52% have recorded declines. Year-over-year, 31% of zip codes have appreciated in price, while 69% have experienced declines. Only 3 zip codes have exceeded their previous peak values, whereas 72 remain below their highs.
Central Texas Cities and Zip Code Analysis
Out of the tracked cities, 9 have seen year-over-year price increases, while 21 have declined. Monthly, 14 cities have recorded price gains, while 14 have fallen. Over the past 12 months, no cities have surpassed their prior peak values, with all 30 still below their highs.
Among the zip codes, 23 have gained in price year-over-year, but 52 have not. Month-over-month, 30 zip codes have seen increases, while 39 have decreased. Only 3 zip codes have exceeded their 12-month peak, while 72 are still in recovery mode.
Sales vs. List Price Analysis
This month, 67.61% of properties sold below the list price, a slight improvement from 71.44% last month. Properties selling at list price rose to 21.39% from 18.21%, and 11.00% sold above list price, up from last month's 10.35%. Back in January 2024, only 9.22% of properties sold above list price. The average sold price to list price ratio stands at 96.83%, suggesting buyers are still negotiating discounts.
Peak Value Analysis: Austin-Area MLS
The median list price has fallen by 9.24% from its May 2022 peak of $539,900, now standing at $490,000. The average sold price has declined by 15.50% from its May 2022 peak of $664,515, now at $561,548. Similarly, the median sold price has dropped by 21.47% from its peak of $538,000, now at $422,500. In terms of price per square foot, the average has declined by 20.99% from its April 2022 peak of $324, now at $256, while the median has fallen by 22.14% from $280 to $218.
Peak Value Analysis: City of Austin
The median list price in the City of Austin is down by 3.60% from its May 2022 peak of $658,589, now at $634,900. The average sold price has fallen by 13.21% from its May 2022 peak of $847,583, now at $735,638. The median sold price has decreased by 22.79% from its peak of $680,000, now at $525,000. Looking at price per square foot, the average has declined by 22.17% from its May 2022 peak of $442, now at $344, while the median has dropped by 26.21% from its April 2022 peak of $393, now at $218.
The Austin real estate market remains a mix of shifting dynamics, offering both challenges and opportunities. Understanding these fluctuations is key to making informed decisions. At Team Price Real Estate, we leverage our data-driven insights and market expertise to guide our clients in an ever-changing market where "Experience Meets Insight" is more than a tagline—it’s our commitment.

