Understanding Leander's Residential Market in August 2024
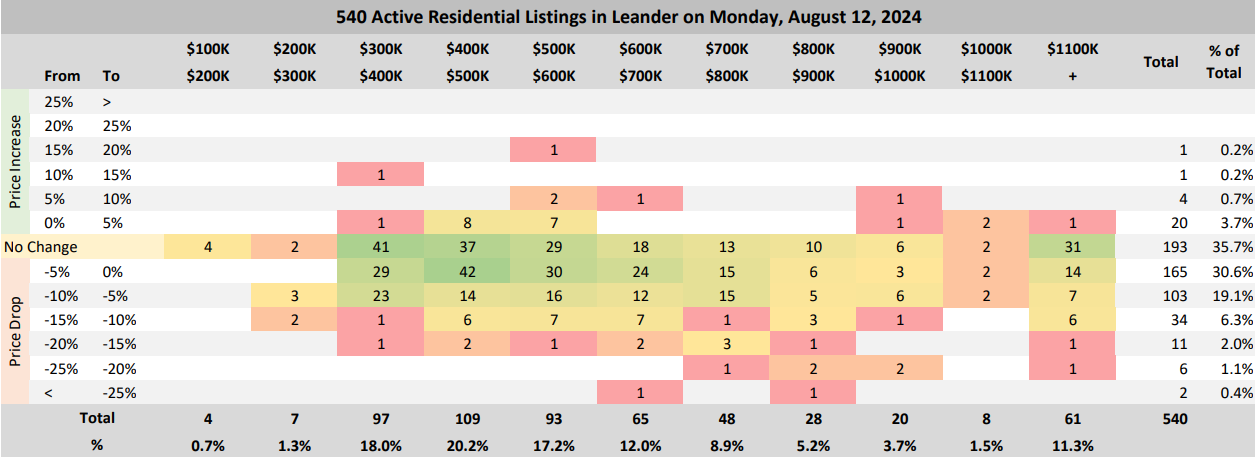
August 12, 2024: The residential real estate market in Leander, Texas, is experiencing notable dynamics that reflect current trends and shifts in buyer and seller behaviors. With 540 active residential listings, this market offers a comprehensive view of pricing strategies, occupancy rates, and the overall pace at which properties are being bought and sold.
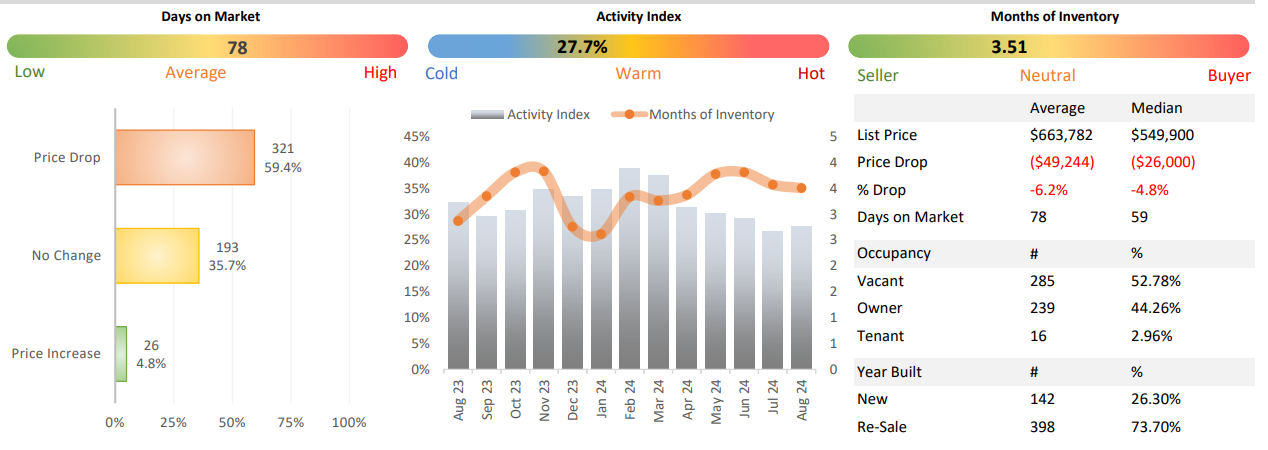
The analysis of pricing trends within Leander reveals that a significant majority of properties are undergoing price adjustments. Out of the 540 active listings, 321 have seen a price drop, accounting for 59.4% of the market. These reductions vary widely, with most properties experiencing decreases within the 0% to 10% range. However, there are cases where price drops exceed this range, indicating sellers' willingness to adjust prices to attract buyers. On the other hand, only 26 listings, representing 4.8% of the total market, have experienced a price increase. This minimal percentage suggests that the market is currently favoring buyers, as sellers are more inclined to lower prices than to raise them.
The price distribution of properties in Leander is diverse, spanning from under $200,000 to over $1,100,000. However, the majority of market activity is concentrated in the mid to upper price ranges, particularly between $300,000 and $600,000. This concentration suggests that the most active segment of the market lies within these price brackets, catering to a significant portion of buyers seeking homes in these ranges. The distribution also highlights that properties priced between $400,000 and $700,000 are particularly competitive, with sellers needing to carefully consider their pricing strategies to stand out in this crowded segment.
Occupancy status provides further insight into the current market conditions. A substantial number of properties—285 out of 540, or 52.78%—are vacant. This high percentage of vacant homes may indicate a buyer's market, where sellers are more motivated to sell quickly, possibly due to the financial burden of maintaining an unoccupied property. In contrast, 239 homes, or 44.26%, are owner-occupied, and only 16 homes, or 2.96%, are tenant-occupied. This distribution suggests that many of the listings are either from sellers who have already moved out or investors looking to offload properties.
The pace at which properties are selling is another crucial aspect of the Leandermarket. The average number of days a property stays on the market is 78, with a median of 59 days. This moderate pace suggests that while properties are selling, they are not moving off the market as quickly as in a hotter market. Sellers might need to prepare for their homes to stay listed for a couple of months before finding a buyer, which may further contribute to the trend of price reductions.
In addition to these factors, the market's segmentation between new builds and resale properties is telling. Of the 540 active listings, 398 are resale properties, comprising 73.7% of the market. Meanwhile, 142 listings are new builds, making up 26.3% of the market. This significant presence of resale properties indicates that the market is predominantly driven by homeowners looking to sell existing homes, rather than new construction. The competition between these two segments could influence pricing and demand, as buyers weigh the benefits of purchasing a new build versus a resale property.
In summary, the residential real estate market in Leander as of August 2024 is characterized by a high level of activity, particularly in the mid-to-upper price ranges, with a clear trend towards price reductions. The high vacancy rate and the moderate pace of sales further underscore a market that is currently favoring buyers. Sellers in Leander must be strategic in their pricing and prepared for a potentially extended time on the market as they navigate these conditions.
Related Articles
Keep reading other bits of knowledge from our team.
Request Info
Have a question about this article or want to learn more?
Leander Real Estate Market: August 2024 Update on Pricing and Trends