
Austin New Construction vs Resale October 2026: Two Markets
Austin Real Estate Market Update October 2, 2026 | Daily Briefing
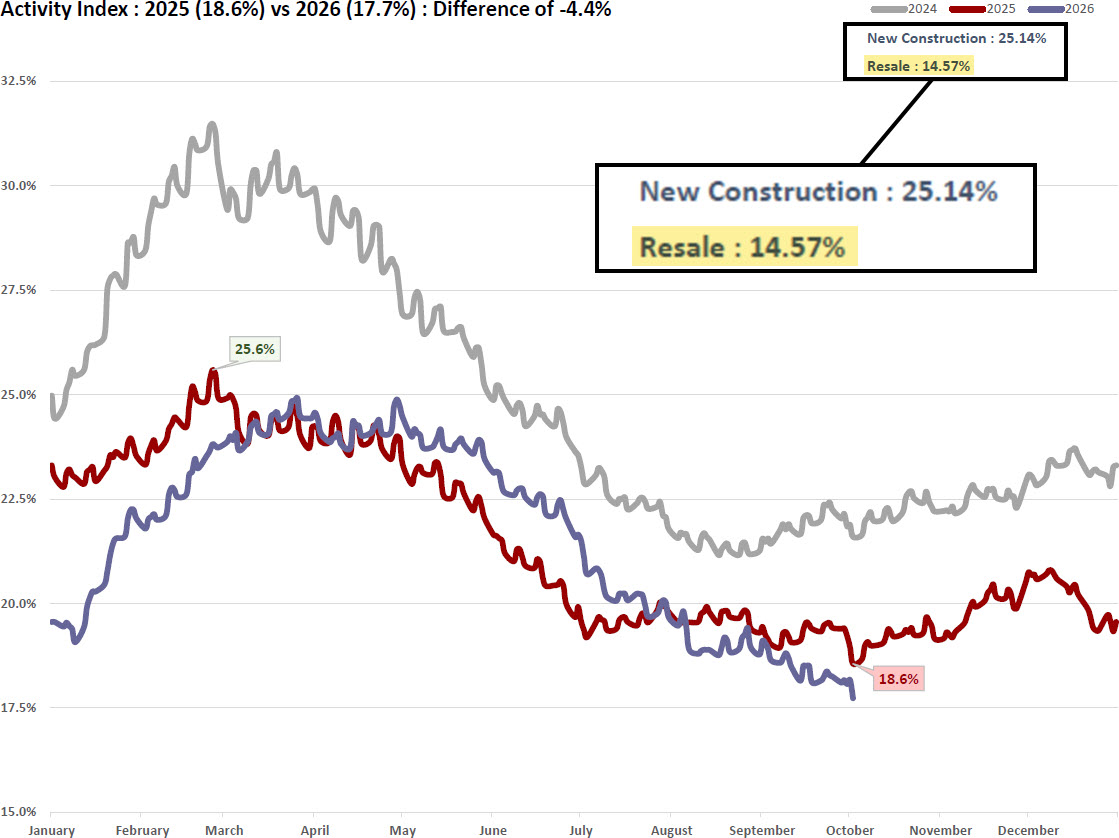
The Austin new construction vs resale October 2026 split has widened into two different markets. Resale homes now carry a 14.57% Activity Index, below the 15% line this report treats as a freeze. New construction sits at 25.14%, just inside the equilibrium band. Same metro, same buyers, same week of rising rates, and the outcome depends almost entirely on who is selling the house.
Scroll down to view the full Austin Daily Real Estate Briefing PDF for Friday, October 2, 2026.
The Activity Index is the share of the for-sale pool that is under contract, calculated as pending listings divided by pending plus active. In plain terms, it answers a simple question: out of every home a buyer could pursue, how many has someone already agreed to buy? Today's file shows 2,084 resale pendings against 12,221 active resale listings, and 1,534 new construction pendings against 4,569 active new homes. Put another way, there are roughly six resale listings for every resale home under contract and roughly three new homes for every new home under contract, both derived from today's counts. A buyer shopping resale is looking at a far deeper pool, with far less competition for each house.
The timing matters because financing just got more expensive. Freddie Mac's 30 year fixed average rose to 7.28% as of October 1, up from 7.03% the week before, compared with 6.34% a year ago. That is the highest reading since November 22, 2023. Builders have been bracing for this. The National Association of Home Builders' September sentiment index fell 3 points to 32, its lowest reading of 2026, and 66% of builders surveyed reported using sales incentives. Lennar reported a third quarter average sales price of $372,000, reflecting roughly 12% in incentives along with base price adjustments, and the company said rising resale inventory had increased competition, especially in Texas and Florida.
That last point is worth sitting with. In Austin, the resale competition builders worry about shows up as supply, not as sales. Resale is 72.8% of active listings but only 57.6% of pending contracts, while new construction is 27.2% of listings and 42.4% of contracts. All four shares are derived from today's counts. Builders are capturing about 1.56 times their share of supply in contracts. Resale sellers are capturing about 0.79 times theirs.
The reason is mechanical, not a verdict on quality. A builder can take money out of its margin and spend it to buy down a buyer's rate or cover closing costs, because it is selling many homes and can spread the cost. An individual resale owner is selling one house, usually with a mortgage to pay off, and has far less room to do the same. When rates climb, the seller who can lower the monthly payment directly wins the contract, and that is what this gap measures. It is not evidence that new homes are better homes.
The math shows why payment beats price right now. Take a $550,000 home in the $500,000 to $600,000 band. There, the median Austin price cut is $31,000, or 5.46%, and 60.10% of listings have cut at least once. With 20% down, principal and interest on the $440,000 loan runs about $3,010 a month at 7.28%. If a builder buys that rate down a full point to 6.28%, the payment falls to about $2,718, a savings of roughly $293 a month. If a resale seller instead takes the median $31,000 cut, the loan shrinks by $24,800 and the payment drops by about $170 a month. Those payment figures are derived from today's rate and the price tier table. They cover principal and interest only and leave out taxes, insurance, and HOA dues. The point is the ratio: in monthly terms, a one point buydown is worth about 1.7 times the typical cut.
The resale weakness is broad rather than local. On the resale market phase page, 22 of 30 tracked cities and 43 of 75 ZIP codes sit below 15%. Cedar Park, at 24.00%, is the only city in the softening band. Only two ZIP codes reach equilibrium: 78733 at 29.41% and 78730 at 27.27%. At the other end, Burnet and Wimberley read below 8%. These are resale only figures, so they cannot be compared directly with the all listings city tables elsewhere in the report.
Across all listings, the Activity Index is 17.7%, down from 18.6% a year ago, which keeps Austin housing in the contraction band of 15% to 20%. Active listings stand at 16,790, up 1.88% from last year, and pendings stand at 3,618, down 3.62%. Pending contracts are a leading indicator, so today's resale reading says more about the next 60 days of closings than any closed price does. Closed prices and absorption are lagging measures and will catch up later.
Nationally, new home sales are holding up better than builder sentiment. New home sales in August came in at a 684,000 annual pace, a 6.4% monthly gain but 2.0% below August 2025. The national median new home price fell 5.8% from a year earlier to $393,700. The same release shows 8.5 months of new home supply at the current sales pace, well above the 5.73 months of inventory in today's Austin data. The two are not comparable, though. The national figure covers new homes only, is seasonally adjusted, and counts homes not yet started. The Austin figure covers all active listings against the local closing pace.
None of this points to a recovery or a bottom. One strong segment inside a soft market is a split, not a turn. What to watch next is whether resale climbs back above 15% as rates settle. The other marker is the next national new home sales report, which Census and HUD scheduled for October 27, 2026.
For resale sellers, the takeaway is that the competition is not the house down the street; it is the builder's financing desk. Price still matters, but a seller paid credit that funds a rate buydown can do more for a buyer's monthly payment than the same dollars taken off the price, and a listing agent should run both numbers before the first cut. For investors, the resale freeze means more negotiating room on existing homes, while builder pricing sets a practical ceiling on what resale can fetch in newer suburbs. For agents, the buyer conversation should start with the monthly payment, not the list price.
The Austin new construction vs resale October 2026 gap gives a clear picture of where leverage in Austin real estate sits today: with buyers on resale, and with builders who can pay to move the rate. Readers who want to follow this split day to day can use teamprice.com/austin-daily-real-estate-briefing for the complete daily market data.
If this PDF does not display, click here to open in a new tab .
FAQ SECTION
Are Austin new construction homes selling faster than resale homes?
Measured by the share of listings under contract, new construction homes in Austin are outselling resale homes by a wide margin right now. Today's Activity Index is 25.14% for new construction and 14.57% for resale. That means about one in four new homes on the market is pending, versus about one in seven resale homes. It works out to roughly three active new homes per new home contract and six active resale homes per resale contract (derived). The Activity Index measures contracts relative to supply, not days to close, so it shows builders converting more of their inventory, not each house closing in fewer days. The main driver is financing, since builders can fund rate buydowns that most resale sellers cannot.
Why can builders offer lower rates than a regular seller?
Builders can offer lower rates because they pay the lender upfront to buy down the buyer's rate, and they spread that cost across their margin on many homes. Lennar offered roughly 12% in buyer incentives last quarter, a budget an individual seller rarely has. With the 30 year fixed at 7.28%, a one point buydown on a $440,000 loan saves about $293 a month in principal and interest (derived, 20% down on a $550,000 home). On the same terms, the median $31,000 price cut in Austin's $500,000 to $600,000 band saves about $170 a month (derived). Resale sellers can fund a buydown through seller paid credits too, within loan program limits, but few offer it as a standard term. Yahoo Finance
How much of Austin's active inventory is new construction?
New construction makes up 4,569 of Austin's 16,790 active listings, or about 27.2% (derived). Resale accounts for the other 12,221 listings, about 72.8%. The more telling number is the share of contracts: new construction holds 1,534 of 3,618 pendings, about 42.4%, so builders are winning far more than their share of buyers. That gap reflects builder financing incentives and should not be read as a sign that new homes are better buys.
Do I have more leverage buying new construction or resale in Austin?
Resale buyers in Austin generally have more leverage on price, while new construction buyers usually have more leverage on financing. With a resale Activity Index of 14.57%, below the 15% freeze line, there are roughly six resale listings for every resale contract (derived). Across all active listings, new and resale combined, 57.1% have taken at least one price cut. Builders, at 25.14%, are moving inventory more steadily, so their flexibility shows up as rate buydowns and closing credits rather than deep price cuts. Compare every offer on the full monthly payment, and remember that temporary buydowns step back up, so judge them on what you will pay in year three, not year one.
What does the Activity Index tell us about the Austin market?
The Activity Index shows what share of Austin's for-sale homes are under contract, and today it reads 17.7% metro-wide, down from 18.6% a year ago. It is calculated as pending listings divided by pending plus active listings. It rises when buyers sign contracts and falls when unsold inventory builds faster than contracts. A 17.7% reading places Austin in the contraction band of 15% to 20%, below the 25% to 30% equilibrium range. Underneath that, new construction reads 25.14% while resale reads 14.57%. Because the index is built on pending contracts, it is a leading indicator and tends to move before closed prices do.
Austin's real estate market, updated daily and built for your phone.
Pull data on the go, share it in real time, or just keep a closer eye on the market.

Download on the App Store · Get it on Google Play
Powered by Team Price Real Estate
Have a Question or Want to Dive Deeper?
If you’d like a custom breakdown of the data, want help interpreting today’s market trends, or just have a question about buying or selling in Austin, let us know. Fill out the form below and a member of our team will get back to you promptly.
Thanks!
We have your information, we will reach out as soon as possible to meet your needs!

