
Austin Upper End Home Prices October 2026: Size vs Price
Austin Real Estate Market Update October 1, 2026 | Daily Briefing
Austin upper end home prices in October 2026 are up 4.2 percent from a year ago across the metro, but inside the City of Austin the most expensive quarter of sales rose because buyers bought bigger homes, not because each square foot cost more.
Scroll down to view the full Austin Daily Real Estate Briefing PDF for October 1, 2026.
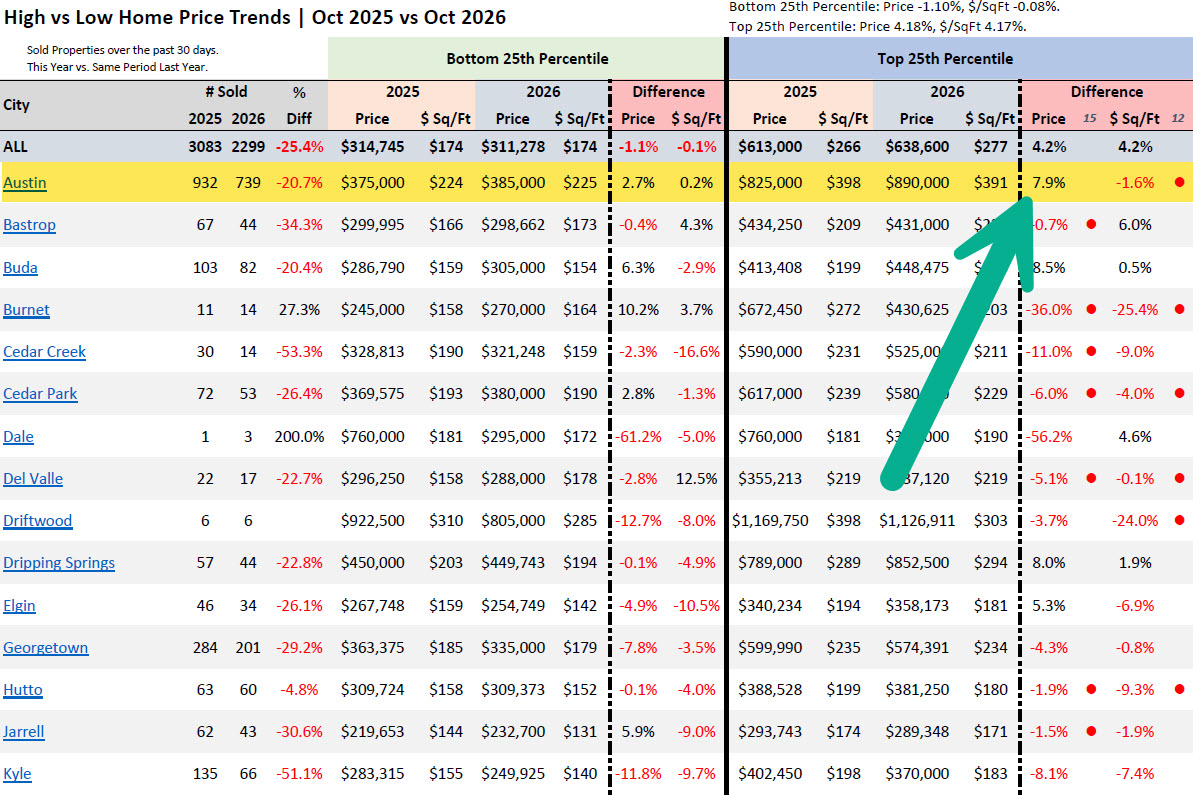
That distinction comes from the percentile analysis in today's Team Price report, which compares homes that closed over the past 30 days with the same window last year. Across the Austin-Area MLS, the 75th percentile sale price, the line that separates the most expensive quarter of closings from the rest, rose to $638,600 from $613,000. Price per square foot at that level rose by the same 4.2 percent, to $277 from $266. At the other end, the 25th percentile sale price slipped 1.1 percent to $311,278, and price per square foot there held flat at $174. On its face, that reads as a market where expensive homes are gaining and starter homes are standing still.
The City of Austin tells a different story. Its 75th percentile sale price jumped 7.9 percent to $890,000, one of the larger gains among cities with meaningful sales volume. Yet price per square foot at that level fell 1.6 percent, to $391 from $398. Price per square foot is simply the sale price divided by the living area, so it shows what buyers paid for each foot of house. When the total price rises while the per-foot price falls, the homes that sold were larger or came from a different mix of neighborhoods, and owners of comparable homes did not gain 7.9 percent. Round Rock shows the same pattern, with its upper-quartile price up 6.7 percent to $545,000 and its price per square foot down 5.1 percent to $215.
National data points in a similar direction but measures something different. Redfin reported in June that the median U.S. luxury sale price rose 4.7 percent over the three months ending May, roughly triple the 1.5 percent gain for mid-priced homes. Redfin defines luxury as the top 5 percent of each metro and compares it with the 35th to 65th percentile over three months, so its figures cannot be set beside a 30 day top quartile in Austin as if they were the same measure. Redfin's own August analysis of the Boston area made the point we are making here: when the headline price outruns price per square foot, part of the gain reflects which homes happened to sell. Realtor.com described the national luxury market in August as being in a period of recalibration, with different segments moving in different directions.
That lens matters because the metro-wide upper-end gain looks broader than it is. Among the 17 cities in the report with at least 25 closings in the window, upper-quartile price per square foot fell in 11 of them, a count we derived from the city rows. Cedar Park fell 4.0 percent, Pflugerville 2.2 percent, Kyle 7.4 percent and Hutto 9.3 percent, while Georgetown was nearly flat at minus 0.8 percent. So how did the metro figure rise 4.2 percent? The most likely explanation is geography. The City of Austin, where per-foot prices are highest, made up 32.1 percent of closings in this window, up from 30.2 percent a year ago by our arithmetic, because suburban sales fell faster. Kyle closings were down 51.1 percent, Leander 31.9 percent and Georgetown 29.2 percent, against 20.7 percent in Austin. The table cannot fully separate price from mix, but the pattern fits a shift toward more expensive locations rather than a broad rise in what each foot of upper-end housing is worth.
For a move-up buyer shopping the upper quarter of the market, which in the metro starts around $640,000, the practical lesson is to negotiate on price per square foot and look past the headline. Here is a simple illustration using derived figures. A 2,000 square foot home at last year's City of Austin upper-quartile rate of $398 would cost $796,000. At today's $391, it would cost $782,000, about $14,000 less. That saving is real, but financing has moved much further. Freddie Mac's weekly survey put the 30 year fixed rate at 7.28 percent today, the sixth straight weekly increase and the highest since November 2023, compared with 6.34 percent a year ago. On a $625,600 loan, which is 20 percent down on that $782,000 home, principal and interest come to about $4,280 a month at today's rate versus about $3,889 at last year's rate, roughly $390 more each month. A softer per-foot price does not come close to covering that.
The supply side gives move-up buyers room to push. In the price tier table, the $600,000 to $700,000 band has 1,136 active listings, 6.00 months of inventory and price cuts on 60.56 percent of listings, with a median cut of $45,000. The $800,000 to $900,000 band shows a median of 90 days on market and the $900,000 to $1 million band shows 105 days, figures that describe listings still for sale rather than completed sales. The Activity Index, which measures pending contracts as a share of all pending and active listings, runs 16.7 percent, 15.5 percent and 13.5 percent across the three bands from $600,000 to $900,000, all below the metro reading of 18.2 percent. Pending contracts are a leading indicator while closed prices are lagging, so the forward signal at the upper end is softer than the closing prices suggest.
The monthly figures fit the same picture, with a caveat. September's median sold price was $430,000, up 3.6 percent from a year ago, and the average was $576,631, up 6.1 percent. Both are preliminary, because September's closing count of 2,073 is still filling in and will revise upward, and September 2025 was a soft comparison month. An average rising faster than the median is what happens when the expensive end carries more weight, and the gap between the two widened to $146,631 from $128,703 a year ago by our arithmetic. The year to date median of $422,412 is a steadier anchor than any single month. The average now sits 15.44 percent below its May 2022 peak while the median sits 21.82 percent below, another sign the upper end has held its ground better. None of this amounts to a turn in the Austin housing market. It is a split inside it.
Other readers should take something different from the same numbers. Sellers of upper-end homes should price from per-foot comparisons in their own city, since per-foot prices at that level fell in most of the larger suburbs. First-time buyers can note that the lower quarter of the market has barely moved, with per-foot prices unchanged at $174, which means the added cost this fall is coming from rates rather than prices. Investors should treat a rising city median with suspicion until price per square foot confirms it.
The 30 day window comes with its own caution. It shows 2,299 closings against 3,083 a year ago, but late reporting for the final days of September will narrow that gap, so it is not evidence of a sales collapse. For anyone following Austin upper end home prices in October 2026, the clearest reading is that expensive homes are selling at higher totals, but buyers are mostly getting more house for the money rather than paying more for each square foot. That is the Austin real estate story worth watching over the next several weeks, and you can follow it at teamprice.com/austin-daily-real-estate-briefing for the complete archive of daily market data.
If this PDF does not display, click here to open in a new tab .
FAQ section
Are luxury homes in Austin falling faster than starter homes?
No, the upper end of the Austin market is currently outperforming the lower end, not falling faster. Over the past 30 days, the metro's top quartile sale price rose 4.2 percent to $638,600, while the bottom quartile slipped 1.1 percent to $311,278. The gain is less broad than it looks: in the City of Austin, top quartile price per square foot fell 1.6 percent to $391, and it fell in 11 of the 17 cities with at least 25 closings. At the very top of the market, the $2 million and above band carries 12.37 months of inventory compared with 5.41 months in the $200,000 to $300,000 band, so true luxury listings take far longer to sell even as upper-middle prices hold.
Are home prices dropping in Austin Texas?
Austin home prices are roughly flat to slightly lower on a year to date basis, with September showing a preliminary gain. The year to date median sold price is $422,412, compared with $431,269 for all of 2025, a 2.1 percent difference measured year to date against a full prior year. September's median of $430,000 is up 3.6 percent from a year ago, but that figure is preliminary and compares against a soft September 2025. By city, 7 of the 30 tracked cities show year to date median gains and 23 show declines, and the metro median remains 21.82 percent below its May 2022 peak of $550,000.
What is the difference between average and median home price in Austin?
The median is the middle sale price, while the average is pulled higher by expensive homes, and in Austin that gap is widening. In September, the median sold price was $430,000 and the average was $576,631, a gap of $146,631 compared with $128,703 in September 2025 by our arithmetic. A widening gap means the upper end is carrying more weight in closings, which fits today's percentile data showing a 4.2 percent top quartile gain against a 1.1 percent bottom quartile decline. Both September figures are preliminary, but the same pattern shows in peak comparisons, with the average 15.44 percent below its May 2022 peak and the median 21.82 percent below.
What is the sold-to-list ratio and what does Austin's number mean?
The sold-to-list ratio compares the final sale price with the last list price, and Austin's September reading of 97.28 percent means sellers received about 97 cents on the dollar of their final asking price. That reading is above September 2025's 96.69 percent and marks the fourth straight month the ratio has beaten the prior year, following June at 97.57 percent, July at 97.39 percent and August at 97.25 percent. The ratio is measured against the final list price, after any cuts, and 56.4 percent of today's 16,760 active listings have had at least one price reduction. A rising ratio alongside widespread cuts usually means sellers are reaching realistic prices before buyers commit, not that buyers are paying more, and September's figure remains preliminary.
Which Austin suburbs are holding value best?
Among suburbs with meaningful sales volume, Bastrop, Liberty Hill, Dripping Springs and Buda are holding value best at the upper end, based on price per square foot. Bastrop's top quartile price per square foot rose 6.0 percent to $222, Liberty Hill's rose 3.4 percent to $221, Dripping Springs rose 1.9 percent to $294 and Buda held at $200, up 0.5 percent. On year to date median sold price, Bastrop is up 4.2 percent, while Cedar Park, Leander, Liberty Hill and Buda are essentially flat. By contrast, upper-quartile price per square foot fell 9.3 percent in Hutto, 7.4 percent in Kyle and 10.8 percent in Manor, so suburbs at similar price points are moving in opposite directions.
Austin's real estate market, updated daily and built for your phone.
Pull data on the go, share it in real time, or just keep a closer eye on the market.

Download on the App Store · Get it on Google Play
Powered by Team Price Real Estate
Have a Question or Want to Dive Deeper?
If you’d like a custom breakdown of the data, want help interpreting today’s market trends, or just have a question about buying or selling in Austin, let us know. Fill out the form below and a member of our team will get back to you promptly.
Thanks!
We have your information, we will reach out as soon as possible to meet your needs!

