
Austin Housing Forecast July 2026: Long Road Ahead
Austin Real Estate Market Update July 17, 2026 | Daily Briefing
Where is the Austin housing forecast really pointing this July, and how long before prices find their footing again? Those are the questions worth asking as the market moves through the back half of the month, and the numbers behind Team Price's Market Flow Score offer a more useful answer than any single week's headline.
Scroll down to view the full Austin Daily Real Estate Briefing PDF for July 17, 2026.
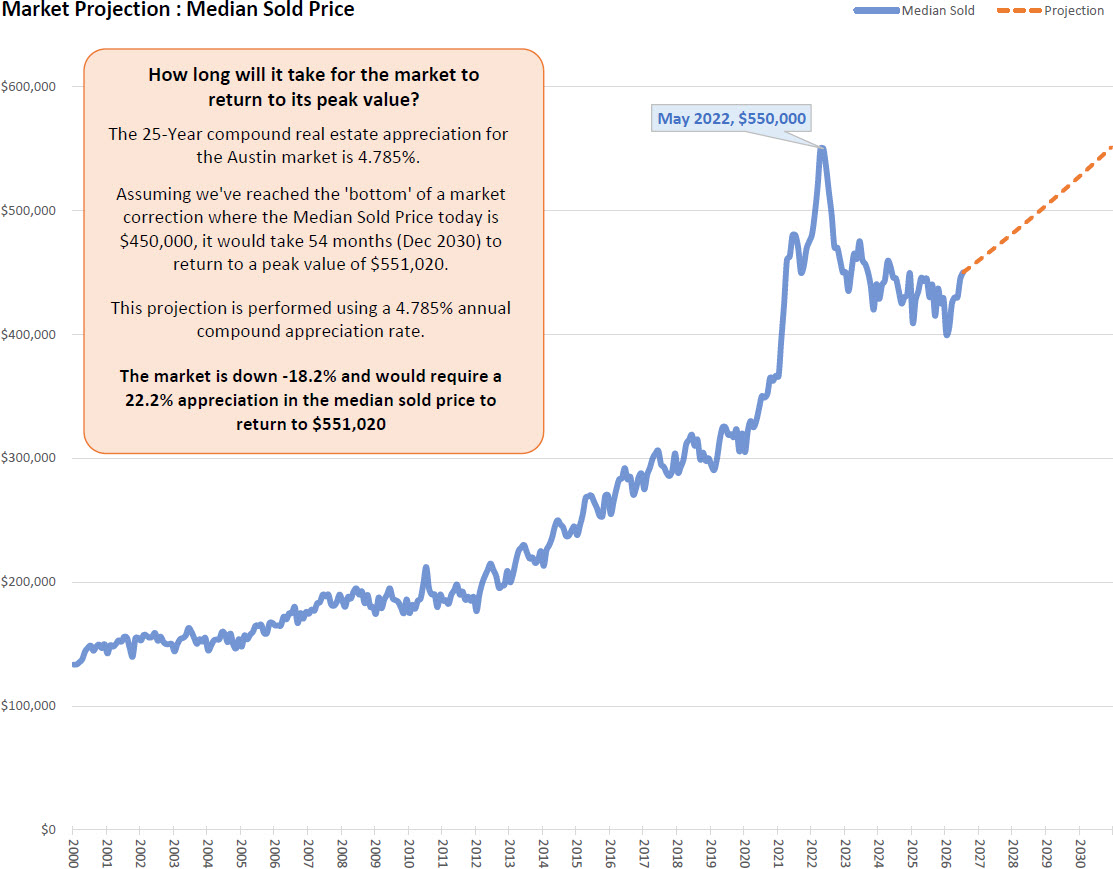
Our latest projection puts a full price recovery in Austin at December 2030, assuming steady historical appreciation from here. The 25-Year compound real estate appreciation for the Austin market is 4.785%. Assuming we've reached the 'bottom' of a market correction where the Median Sold Price today is $450,000, it would take 54 months (Dec 2030) to return to a peak value of $551,020. This projection is performed using a 4.785% annual compound appreciation rate. The market is down -18.2% and would require a 22.2% appreciation in the median sold price to return to $551,020.
The Market Flow Score, or MFS, blends several turnover metrics into one reading on a 0 to 10 scale, where higher numbers mean faster turnover and stronger demand. Right now it sits at 5.70, below the historical average of 6.55. That gap matters, but so does the direction. A genuine shift from correction to recovery requires four consecutive months of year over year improvement across the core metrics that feed this score, and Austin has not reached that mark yet, so any austin housing forecast built on this month's numbers should stay measured rather than declare victory early.
Supply gives some of the clearest signals. Active residential listings across the Austin metro area total 17,731 as of mid July, down about 1 percent from the 17,907 recorded at this point last year, and also down from the all time peak of 18,146 set on June 30 of last year. New construction accounts for 4,305 of those active listings, with resale making up the remaining 13,426. Months of Inventory, which estimates how long it would take to sell through everything on the market at the current sales pace, sits at 6.04 months, down from 6.37 a year ago. More than half of all active listings, 54.2 percent, have taken at least one price cut, which tells buyers there is still real room to negotiate almost anywhere in the metro.
Demand is where the forecast gets more interesting, because pending sales lead the market by weeks while closed sales lag behind by a month or more. Pending listings reached 4,453 this year compared to 4,351 last year, a 2.3 percent increase, with new construction pendings at 1,687 and resale pendings at 2,766. The Activity Index, which measures the share of active inventory currently under contract, climbed to 20.1 percent from 19.5 percent a year ago. That is a small move, but it is a move in the right direction, and it is the kind of steady, unglamorous improvement that eventually shows up in the Market Flow Score if it continues.
Price tells a more complicated story. The year to date median sold price in Austin is $426,407, which is the number worth trusting over any single month's figure, since higher priced homes tend to close earlier in the month and can push a preliminary monthly number up before the rest of the data comes in. July's standalone median came in at $450,000, but that figure carries the same early month skew and should not be read as a clean comparison point yet. Either way, the broader picture has not changed much. The median sold price remains 18.18 percent, or about $100,000, below its May 2022 peak of $550,000, and average sold price is down 9.12 percent, or roughly $62,000, from its own high. Measured against just 36 months ago rather than the absolute peak, the median is down a much smaller 2.17 percent, which suggests the pace of decline has slowed considerably even without a confirmed turnaround.
This is where the forecast math comes in. Based on the PNG historical table Team Price maintains for month end comparisons, and assuming the market has found its bottom at the current $450,000 median, it would take roughly 54 months, or until December 2030, to climb back to the prior peak of $551,020. That projection uses a 4.785 percent annual compound appreciation rate, consistent with the last 25 years in this market. It is a model, not a guarantee, and it depends on demand holding steady or continuing to improve from where it sits today.
The Absorption Rate adds another layer to this austin housing forecast. It measures the share of active listings that sell in a given period, and it currently sits at 20.59 percent against a historical average of 31.32 percent. That is still a wide gap, but it has been drifting upward rather than sliding further, which lines up with the small gains showing up in pending sales and the Activity Index. None of these numbers on their own confirm a recovery, but taken together they describe a market that is stabilizing in small increments rather than continuing to soften.
Geography adds nuance too. Seven cities across the Austin metro saw their median sold price rise year over year, while 21 saw declines, and the Sellers per Buyer ratio across the metro sits at 2.7, which classifies as a Balanced market overall even though most individual resale segments fall into the Contraction or Crisis phase when measured city by city. New construction continues to carry a noticeably stronger Activity Index than resale, a pattern that has held for months and is worth watching if you are comparing builder incentives against resale flexibility in your own search.
For buyers, sellers, investors, and agents trying to plan the next few months, the honest read on this austin housing forecast is gradual movement rather than a clean turning point. Anyone who wants the full breakdown, including the price tier data and suburb level detail behind these numbers, can find the complete archive at the Austin Daily Real Estate Briefing at teamprice.com/austin-daily-real-estate-briefing for the complete archive of daily market data. Whether you are watching for signs of an austin real estate forecast shift or just trying to make sense of today's austin market update, patience remains the more useful strategy than prediction right now.
If this PDF does not display, click here to open in a new tab .
FAQ Section
How long does it take to sell a home in Austin right now?
Most homes in Austin are taking roughly two to three months to sell, though the timeline varies a lot by price range. Median days on market run from about 60 days for homes priced between $200,000 and $600,000 up to 80 or 90 days for listings above $1.5 million, based on the current price tier data. A faster moving slice of the market exists too, since about 15 percent of this month's pending contracts were listed and went under contract within just 30 days, with a median of only 7 days to pending among that group, but that figure describes a fast moving subset, not the market as a whole. Buyers and sellers should plan around the broader 60 to 90 day range rather than assuming every home moves that quickly.
What is the median home price in Austin in 2026?
The year to date median sold price in Austin through July is $426,407, and that is the more reliable figure to use when comparing this year to last, since single month numbers can be skewed by when higher priced homes happen to close. The standalone July figure came in at $450,000, but because pricier homes tend to close earlier in the month, that number can run a bit high until the month is fully complete. Both figures sit well below the $550,000 median peak reached in May 2022. For anyone budgeting a purchase or pricing a listing, the year to date figure gives the clearer read on where typical home values stand today.
Is Austin real estate overvalued or undervalued?
Austin home prices are still working through a correction from their 2022 peak rather than sitting at overvalued levels. The median sold price is down 18.18 percent from its May 2022 high, and the Absorption Rate of 20.59 percent remains well below the historical average of 31.32 percent, both signs that demand has not caught up to the run up in prices from a few years ago. At the same time, sold to list price ratios remain close to 97.5 percent across most price tiers, meaning sellers who price realistically are still getting close to their asking price. That combination points to a market that has adjusted meaningfully but has not overcorrected into bargain territory across the board.
How much have Austin home prices dropped from their peak?
The median sold price has dropped 18.18 percent, or about $100,000, from its May 2022 peak of $550,000 down to $450,000 today. Average sold price has fallen a smaller 9.12 percent, or about $62,000, from its own peak of $681,939 down to $619,753. The gap between those two percentages suggests the decline has been sharper in the middle of the market than at the very top end, where luxury buyers have kept more of their pricing power. Measured against just 36 months ago rather than the absolute peak, the median is down a much smaller 2.17 percent, which suggests the pace of decline has slowed considerably even though prices have not turned upward in a sustained way.
What does the Activity Index tell us about the Austin market?
The Activity Index measures what share of active listings are currently under contract, and Austin's overall reading climbed to 20.1 percent this year from 19.5 percent last year, a small but real gain that feeds directly into this month's Market Flow Score. New construction continues to carry a stronger reading than resale, 28.15 percent compared to 17.08 percent, a gap that has held for months. Most individual resale submarkets, 41 percent of tracked cities, currently fall into the Contraction or Danger Zone phase, with another 29 percent in the Crisis or Freeze phase, meaning slower sales and continued price softness remain the norm outside of new construction even as the metro wide average improves.
Austin's real estate market, updated daily and built for your phone.
Pull data on the go, share it in real time, or just keep a closer eye on the market.

Download on the App Store · Get it on Google Play
Powered by Team Price Real Estate
Have a Question or Want to Dive Deeper?
If you’d like a custom breakdown of the data, want help interpreting today’s market trends, or just have a question about buying or selling in Austin, let us know. Fill out the form below and a member of our team will get back to you promptly.
Thanks!
We have your information, we will reach out as soon as possible to meet your needs!

