
Austin New Construction vs Resale Suburbs July 2026
Austin Real Estate Market Update July 16, 2026 | Daily Briefing
New construction homes in Austin suburbs are quietly outperforming the rest of the market in July 2026, and the numbers behind that story are hard to ignore. While the broader austin real estate market continues to look balanced on the surface, a look underneath the headline figures shows two very different markets living side by side, one built on new construction and one built on resale homes, and the gap between them keeps widening.
Scroll down to view the full Austin Daily Real Estate Briefing PDF for July 16, 2026.
Start with the plain facts. Austin has 17,657 active residential listings right now, down about seven tenths of one percent from the 17,784 listed at this time last year. Of those listings, 4,268 are new construction homes and 13,389 are resale properties, so resale still makes up the large majority of what is on the market. Pending sales tell a similar story in reverse proportion but a very different pace story. There are 1,691 new construction homes currently pending and 2,786 resale homes pending, for a total of 4,477 pending contracts, up 2.8 percent from 4,353 a year ago.
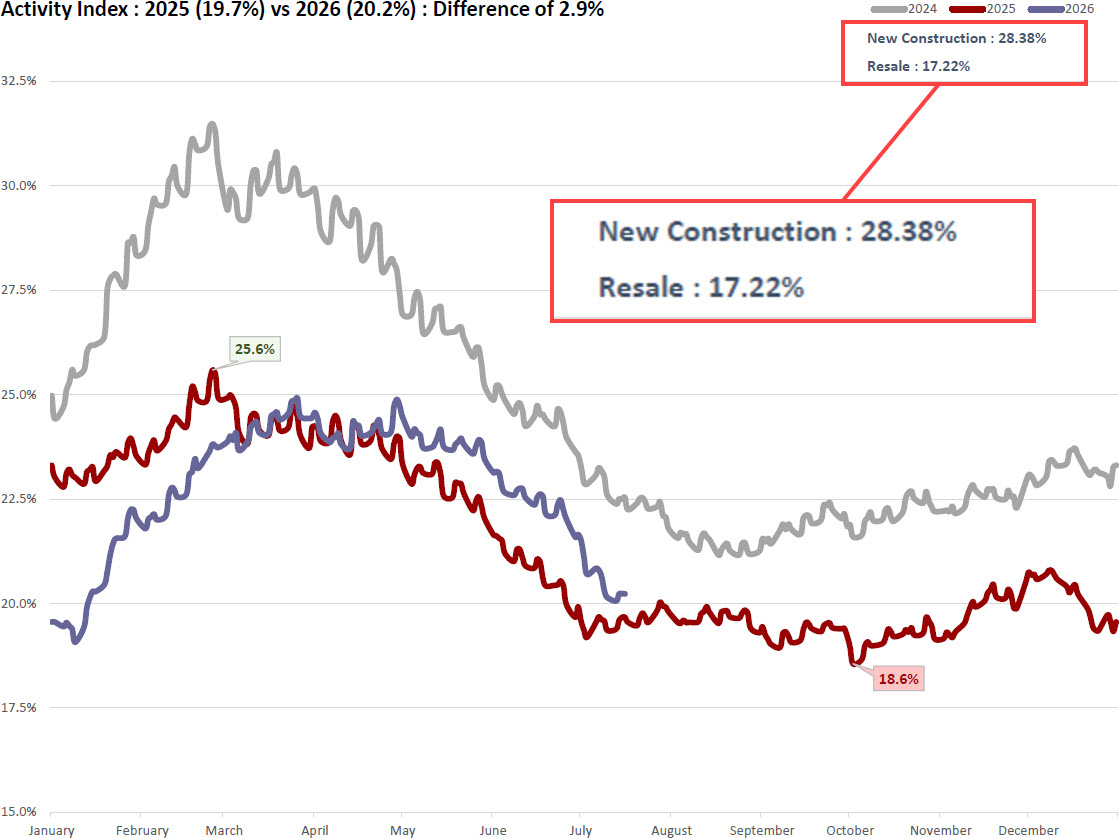
The real difference shows up in the Activity Index, which measures how much of the active inventory is actually moving into pending status. New construction homes carry an Activity Index of 28.38 percent, while resale homes sit at just 17.22 percent. That is a real and consistent gap, not a one month blip. Builders in Austin suburbs have been running well ahead of the resale market for months, and this kind of divergence has become one of the more reliable threads to watch in the austin housing forecast for the rest of the year.
Zooming into specific cities helps explain why. Cedar Park currently posts the tightest resale Activity Index in the metro at 25.74 percent, backed up by the shortest Months of Inventory figure at 3.01. Buda follows at 21.19 percent, with Hutto at 20.44 percent, Round Rock at 20.16 percent, and Pflugerville at 20.12 percent. These are inner ring and near suburb markets where resale homes are absorbing at a pace closer to what new construction is doing metro wide. On the other end, cities like Marble Falls, Burnet, Dale, Smithville, and Wimberley are carrying Months of Inventory figures well above nine, some over twelve, which points to a much slower, more buyer friendly pace out on the edges of the metro. This inner ring versus outer ring split is worth watching as part of any longer term austin real estate forecast, since it shapes where new construction is likely to keep concentrating.
Pricing tells its own story, and it is important to separate what is a leading signal from what is a lagging one. Pending sales are a leading indicator of where demand is headed, since they reflect decisions buyers are making right now. Sold prices, by contrast, are a lagging indicator, since they reflect contracts that were negotiated weeks or months earlier. The year to date median sold price for Austin sits at 427,835 dollars, down slightly from 431,781 dollars over the same period last year. The July figure so far shows a median of 460,000 dollars, but that number should be read with some caution this early in the month, since higher priced homes tend to close in the first third of the month while more affordable homes tend to close closer to month end, which can skew a mid month figure upward. The year to date number is the more reliable anchor for where austin housing prices actually stand right now.
The Market Flow Score, which combines several turnover metrics into a single reading of market efficiency, currently sits at 5.68, below the historical average of 6.55. This score has been building back up from its 2025 lows, but the year over year improvement streak that had been forming broke in June, so it would not be accurate to call this a recovery yet. A recovery label requires four consecutive months of improvement across all of Austin's core metrics, and that threshold has not been met. For now, the more accurate read is a market that is still working through a correction, with pockets of real strength, especially in new construction and in a handful of resale submarkets like Cedar Park and Round Rock.
Absorption Rate, which measures the share of active listings that sell in a given period, sits at 20.53 percent, well below the historical average of 31.32 percent. That gap reinforces the picture of a market where roughly a fifth of what is on the shelf is moving at any given time, a pace that favors buyers with patience and gives sellers reason to price carefully, particularly outside the tighter inner ring suburbs.
For buyers, the takeaway is straightforward. New construction homes in Austin suburbs, particularly in Cedar Park, Buda, and Round Rock, are moving faster and offer more competition, while resale homes in outer ring cities like Marble Falls or Wimberley offer more room to negotiate and more time to decide. For sellers of resale homes outside the tightest submarkets, patience and realistic pricing remain the name of the game. For investors and agents working this austin market update, the new construction versus resale divergence is shaping up to be one of the defining stories of the summer, and it is worth tracking city by city rather than relying on a single metro wide number. You can find more detail day by day in the Austin Daily Real Estate Briefing at teamprice.com/austin-daily-real-estate-briefing for the complete archive of daily market data.
If this PDF does not display, click here to open in a new tab .
FAQ Section
Is now a good time to buy a home in Austin?
For buyers with flexibility on timing, July 2026 offers more room to negotiate than Austin has seen in several years. Months of Inventory sits at 6.02, and the Absorption Rate of 20.53 percent is well below the historical average of 31.32 percent, meaning listings are sitting longer and sellers are more open to price discussion. New construction homes in suburbs like Cedar Park and Round Rock are moving faster, so buyers interested in those areas should expect more competition than in resale heavy markets like Marble Falls or Wimberley. Overall, buyers who do their homework on a specific city rather than the metro average will find the most opportunity right now.
Are home prices dropping in Austin Texas?
Yes, Austin home prices remain below their 2022 peak, though the pace of decline has slowed considerably. The year to date median sold price of 427,835 dollars is down slightly from 431,781 dollars a year ago, and the median is still about 16 percent below the May 2022 peak of 550,000 dollars. The July month to date figure of 460,000 dollars looks higher, but that number should be read carefully since higher priced homes tend to close earlier in the month, which skews mid month figures upward. The broader trend is one of a market that has stabilized more than it is actively falling.
What is the Austin housing market forecast for 2026?
The forecast for the rest of 2026 points to a market that continues to stabilize gradually rather than swing sharply in either direction. The Market Flow Score of 5.68 remains below the historical average of 6.55, and the year over year improvement streak that had been building broke in June, so a full recovery has not yet been confirmed. New construction is likely to keep outperforming resale in Activity Index terms, particularly in suburbs like Cedar Park, Buda, and Round Rock, while outer ring cities may continue to see slower absorption. Watching whether the Market Flow Score can string together four consecutive months of improvement will be the clearest signal of where the market is actually headed.
How does Austin inventory compare to historical levels?
Austin's current inventory of 17,657 active listings is essentially flat compared to a year ago, down about seven tenths of one percent from 17,784. Months of Inventory at 6.02 is an improvement from 6.33 last year, suggesting inventory is being absorbed slightly faster than it was in 2025. Compared to the deep shortages of 2021 and 2022, today's inventory levels are far more balanced and give buyers meaningfully more choice. Even so, the Absorption Rate of 20.53 percent remains well below the 31.32 percent historical average, so inventory is still moving more slowly than the long run norm.
Which Austin cities have the most price drops right now?
Across the entire Austin MLS, 54.2 percent of all active listings have had at least one price drop, which is a strong signal of a market where sellers are actively adjusting to buyer expectations. Cities like Bastrop, at 63.2 percent of listings with a price cut, and Lockhart, at 62.9 percent, currently show some of the highest shares of price reductions in the metro. Kyle, at 59.7 percent, and Georgetown, at 57.3 percent, also show elevated price cut activity. Buyers targeting these cities specifically may find sellers more willing to negotiate than the metro average would suggest.
Austin's real estate market, updated daily and built for your phone.
Pull data on the go, share it in real time, or just keep a closer eye on the market.

Download on the App Store · Get it on Google Play
Powered by Team Price Real Estate
Have a Question or Want to Dive Deeper?
If you’d like a custom breakdown of the data, want help interpreting today’s market trends, or just have a question about buying or selling in Austin, let us know. Fill out the form below and a member of our team will get back to you promptly.
Thanks!
We have your information, we will reach out as soon as possible to meet your needs!

