
Austin Home Inventory Falls to 17,573 in July 2026
Austin Real Estate Market Update July 6, 2026 | Daily Briefing
Austin home inventory is showing its first real signs of pulling back after two years of steady buildup, and that shift matters for anyone weighing a move in the austin housing market this summer. As of July 6, 2026, active residential listings across the Austin metro stood at 17,573, still below the all-time high of 18,146 recorded on June 30, 2025. That gap of 573 listings puts current supply down 0.98 percent compared to July 2025, when 17,747 homes were on the market. For buyers who have grown used to abundant choice over the past two years, this is a meaningful data point, even if the decline so far is modest.
Scroll down to view the full Austin Daily Real Estate Briefing PDF for July 6, 2026.
Months of inventory tells a similar story. This figure measures how long it would take to sell through the current supply of homes at today's sales pace, and it fell to 6.07 months in July, down 3.9 percent from 6.32 months a year ago. A falling months of inventory reading generally points toward a market with less breathing room for buyers than it had previously, since there is simply less unsold supply sitting on the shelf relative to how fast homes are actually selling. Combined with the pullback in raw active listings, this is one of the more concrete signs yet that the supply surge Austin has experienced since 2023 is starting to slow.
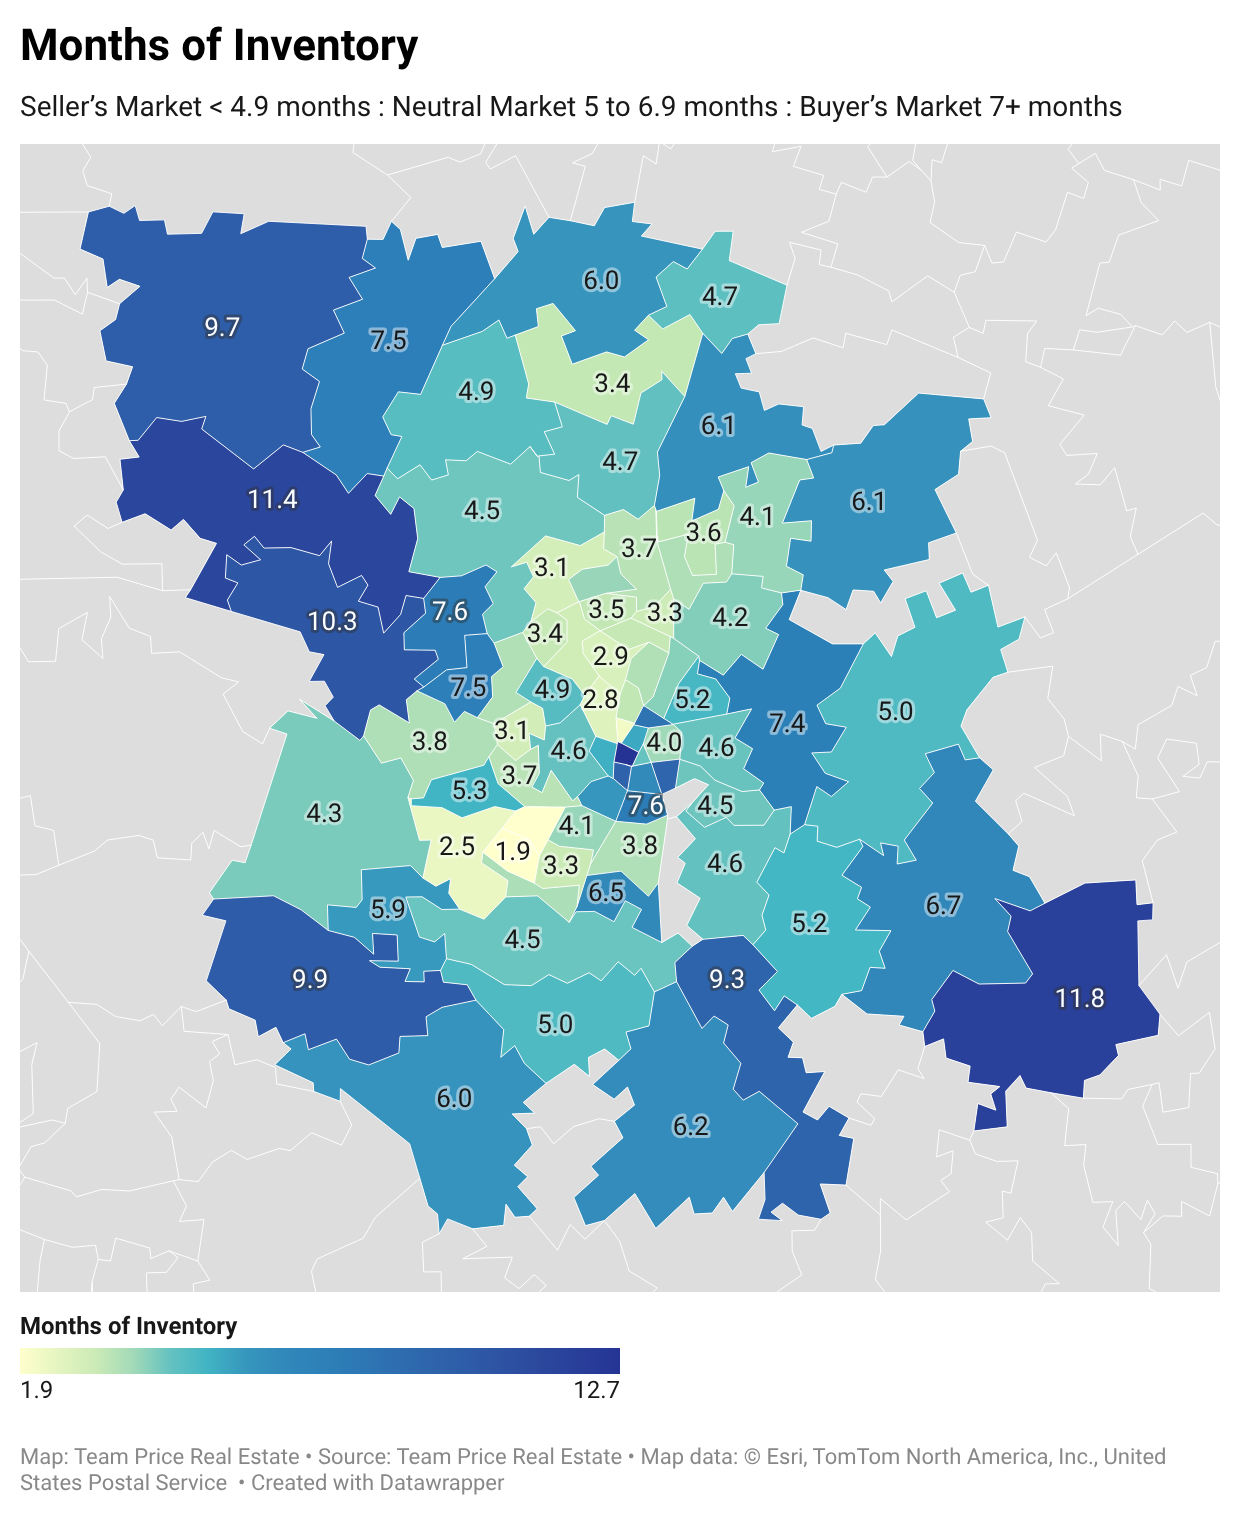
It helps to break that inventory down by type. Of the 17,573 total active listings, 4,161 are new construction and 13,412 are resale homes. The two segments are behaving very differently right now. New construction carries an Activity Index of 28.86 percent, while resale sits at just 17.96 percent, a gap of nearly eleven points. Builders are clearing their inventory noticeably faster than individual homeowners are selling theirs, a pattern that has held for months and is worth factoring in for anyone comparing a new build against a resale home in the same neighborhood.
Freshness data adds more texture to the picture. Of the 17,573 active listings, 25.1 percent hit the market within the past 30 days, and homes that do go under contract within that same 30 day window are doing so in a median of just 6 days. That figure only applies to the roughly 12 percent of pending contracts that were listed and went pending in the same short window, so it should not be read as a typical timeline for the broader market. Meanwhile, 52.3 percent of all active listings have had at least one price cut, a reminder that speed for the right home does not mean pricing is being forgiven across the board.
On the demand side, pending sales offered one of the more encouraging signals in today's data. Pending listings reached 4,625 in the most recent reading, up 7.4 percent from 4,307 a year ago. Since pending sales are a leading indicator of where the market is headed, while sold prices lag behind, this uptick deserves attention. It is worth tempering that enthusiasm slightly, though, since the cumulative pending count from January through July still sits at 25,411, down 7.7 percent year over year and 1.1 percent below the twenty-six-year historical average for this point in the calendar. One strong monthly reading is a data point worth watching, not yet a trend austin real estate forecast watchers should lean on heavily.
The Activity Index, which blends new construction and resale demand into a single measure, climbed to 20.8 percent in 2026 compared to 19.5 percent a year ago, a gain of 6.7 percent. That is a positive signal on its face, but it falls well short of the four consecutive months of improvement across all core metrics that would be needed to responsibly call this a recovery. In fact, the Market Flow Score, Austin's broader efficiency gauge, sits at 5.22 against a historical average of 6.55, and June's reading came in below June of last year, breaking a streak of year over year gains that had built through the spring. Recovery language remains premature for now, even with the encouraging pullback in supply.
Price data continues to reflect a market that has cooled meaningfully from its 2022 highs without falling off a cliff. The median sold price for July stands at $469,500, still 14.64 percent below the May 2022 peak of $550,000. Based on the historical 4.956 percent compound annual appreciation rate for Austin, it would take roughly 42 months, or until December 2029, for prices to climb back to that reference peak. The sold to list ratio of 97.49 percent shows sellers are generally settling for a little over 2 percent below their original asking price, which is consistent with where this ratio has held for the past two years.
Taken together, today's numbers describe an austin housing market where supply is finally showing early signs of pulling back after two years of record buildup, while pending demand nudges upward at the same time. It is worth noting that the new listing to pending ratio, a separate measure of how many new listings convert to contracts each month, tends to run low in the first week of July specifically because of the Independence Day holiday, when fewer sellers list homes and fewer buyers shop over the long weekend, so that figure is not being used to anchor today's supply story. For agents advising clients on timing, the more reliable signals right now are the pullback in raw active listings and the drop in months of inventory, both of which point toward a market with slightly less cushion than it had a year ago. Readers can follow the daily numbers behind this austin market update, along with broader austin housing forecast trends, at the Austin Daily Real Estate Briefing at teamprice.com/austin-daily-real-estate-briefing for the complete archive of daily market data.
If this PDF does not display, click here to open in a new tab .
FAQ Section
What does the Market Flow Score mean for Austin buyers and sellers?
The Market Flow Score, or MFS, tells buyers and sellers how efficiently homes are moving through the Austin market, and right now it sits at 5.22 compared to a historical average of 6.55. The score combines four turnover measures, including the active to sold ratio and market absorption efficiency, into a single 0 to 10 reading, where higher numbers mean faster turnover and stronger demand. A reading below average, like today's, generally signals a market where buyers can expect more room to negotiate and sellers should plan for longer marketing times. June's MFS also came in below last June's level, breaking a run of year over year improvement that had built through the spring, so it is too early to describe this as a recovering market even with active listings pulling back slightly.
How long will it take for Austin home prices to recover to their 2022 peak?
Based on current projections, it would take about 42 months, or until December 2029, for Austin's median sold price to climb back to its prior peak. The median sold price hit $550,000 in May 2022 and has since fallen to $469,500 today, a drop of 14.64 percent. The projection uses a 4.956 percent compound annual appreciation rate, the market's 25-year historical average, and calculates that home values would need to rise 17.1 percent from here to reach the reference peak value of $552,143. This is a mathematical projection based on historical appreciation trends, not a guarantee, and the actual timeline could move faster or slower depending on how supply and demand shift in the coming months.
Is Cedar Park Texas a good place to buy a home in 2026?
Cedar Park is shaping up as one of the more competitive suburbs for buyers to watch in 2026, with tighter inventory than much of the metro. The suburb currently has 264 active listings and about 3 months of inventory, a level that falls into the tightest supply tier tracked in this report and suggests homes are moving faster there than in most other Austin suburbs. Cedar Park's Activity Index sits at 23.3 percent with a sellers per buyer ratio of 2.1, putting it in balanced territory overall, but the low months of inventory means well-priced homes are not likely to sit long. Buyers interested in Cedar Park should be ready to move decisively and have financing lined up in advance, since the tighter supply gives sellers a bit more leverage than in slower-moving parts of the metro.
What is happening with new construction in the Austin market?
New construction continues to significantly outpace resale in market activity across Austin, with an Activity Index of 28.86 percent compared to just 17.96 percent for resale homes. New construction accounts for 4,161 of the 17,573 active listings and 1,688 of the 4,625 pending contracts, meaning builders are absorbing their inventory noticeably faster than existing homeowners are selling theirs. This gap has held steady for months and likely reflects builder incentives, rate buydowns, and pricing flexibility that individual resale sellers cannot always match. Buyers weighing a new build against a resale option in the same area should factor in these incentives, since they can meaningfully change the real cost comparison between the two.
Are Austin home sellers still getting their asking price?
Yes, Austin sellers are still capturing a strong share of their asking price, with the sold to list ratio at 97.49 percent in July 2026. That is down from a high of 104.8 percent during the 2021 boom, when bidding wars pushed sale prices above list price, but it is consistent with the roughly 97 percent range that has held steady over the past two years. In practice, this means the average seller is conceding a little over 2 percent off their original asking price to close a sale. With 52.3 percent of all active listings having had at least one price cut, sellers are still advised to price accurately from the start, since homes that start too high in this market are the ones most likely to need a reduction later.
Austin's real estate market, updated daily and built for your phone.
Pull data on the go, share it in real time, or just keep a closer eye on the market.

Download on the App Store · Get it on Google Play
Powered by Team Price Real Estate
Have a Question or Want to Dive Deeper?
If you’d like a custom breakdown of the data, want help interpreting today’s market trends, or just have a question about buying or selling in Austin, let us know. Fill out the form below and a member of our team will get back to you promptly.
Thanks!
We have your information, we will reach out as soon as possible to meet your needs!

